PEO Cost per Employee Benchmarks for Series B Startups
Flat-rate PEO pricing outpaces percentage models as Series B startups scale and salaries climb.
The structural reason cost per employee shifts is that economies of scale begin to favor the company, not the PEO: per-employee fee spreads compress as headcount grows, while payroll-percentage models compound upward as salaries rise with seniority. Putting those two forces side by side gives a finance lead a genuinely confusing picture, one where the same growth that should lower unit costs can just as easily raise them, depending entirely on which pricing structure got signed back at seed.
Operationally, the ground has shifted too. Internal HR capacity starts forming, benefit needs diversify, and multi-state hiring accelerates.
That mismatch is why finance teams tend to be under-equipped here. What follows is a benchmarking reference built for finance and HR leads who need real numbers to model a renewal or exit decision, not the ranges a vendor's sales deck hands over. Series B headcount and payroll profile typically move past the 25–50 employee band where PEO pricing first shifts, often approaching or crossing 75–150 employees, where per-head economics change materially. Finance teams are under-equipped to model this because the headline PEPM quote and the all-in cost per employee are different numbers, and the gap is widest in the 50–150 employee band that defines most Series B companies.
The two pricing models PEOs use and their cost to a Series B company in practice
Two pricing structures dominate the market, and they behave almost oppositely as a company scales. One named provider, Justworks, publishes flat rates directly: $59 per employee per month on its Basic plan and $109 on its Plus plan PEO Cost 2026: Pricing Models and Real Numbers.
The appeal of flat PEPM for a finance team is straightforward. Raises, bonuses, and commission payouts don't automatically push the admin fee higher, which makes the number far easier to forecast a year out.
The percentage-of-payroll model works differently, and less favorably as a company matures. The trouble is what happens as the average salary on the roster climbs toward senior IC and manager pay bands: a percentage fee scales right along with it, so a year-end sales bonus or an engineering comp adjustment inflates the PEO bill directly, with no cap and no negotiation required on the vendor's part. The math gets stark quickly. TriNet and ADP TotalSource typically price this way, though neither publishes specific rates.
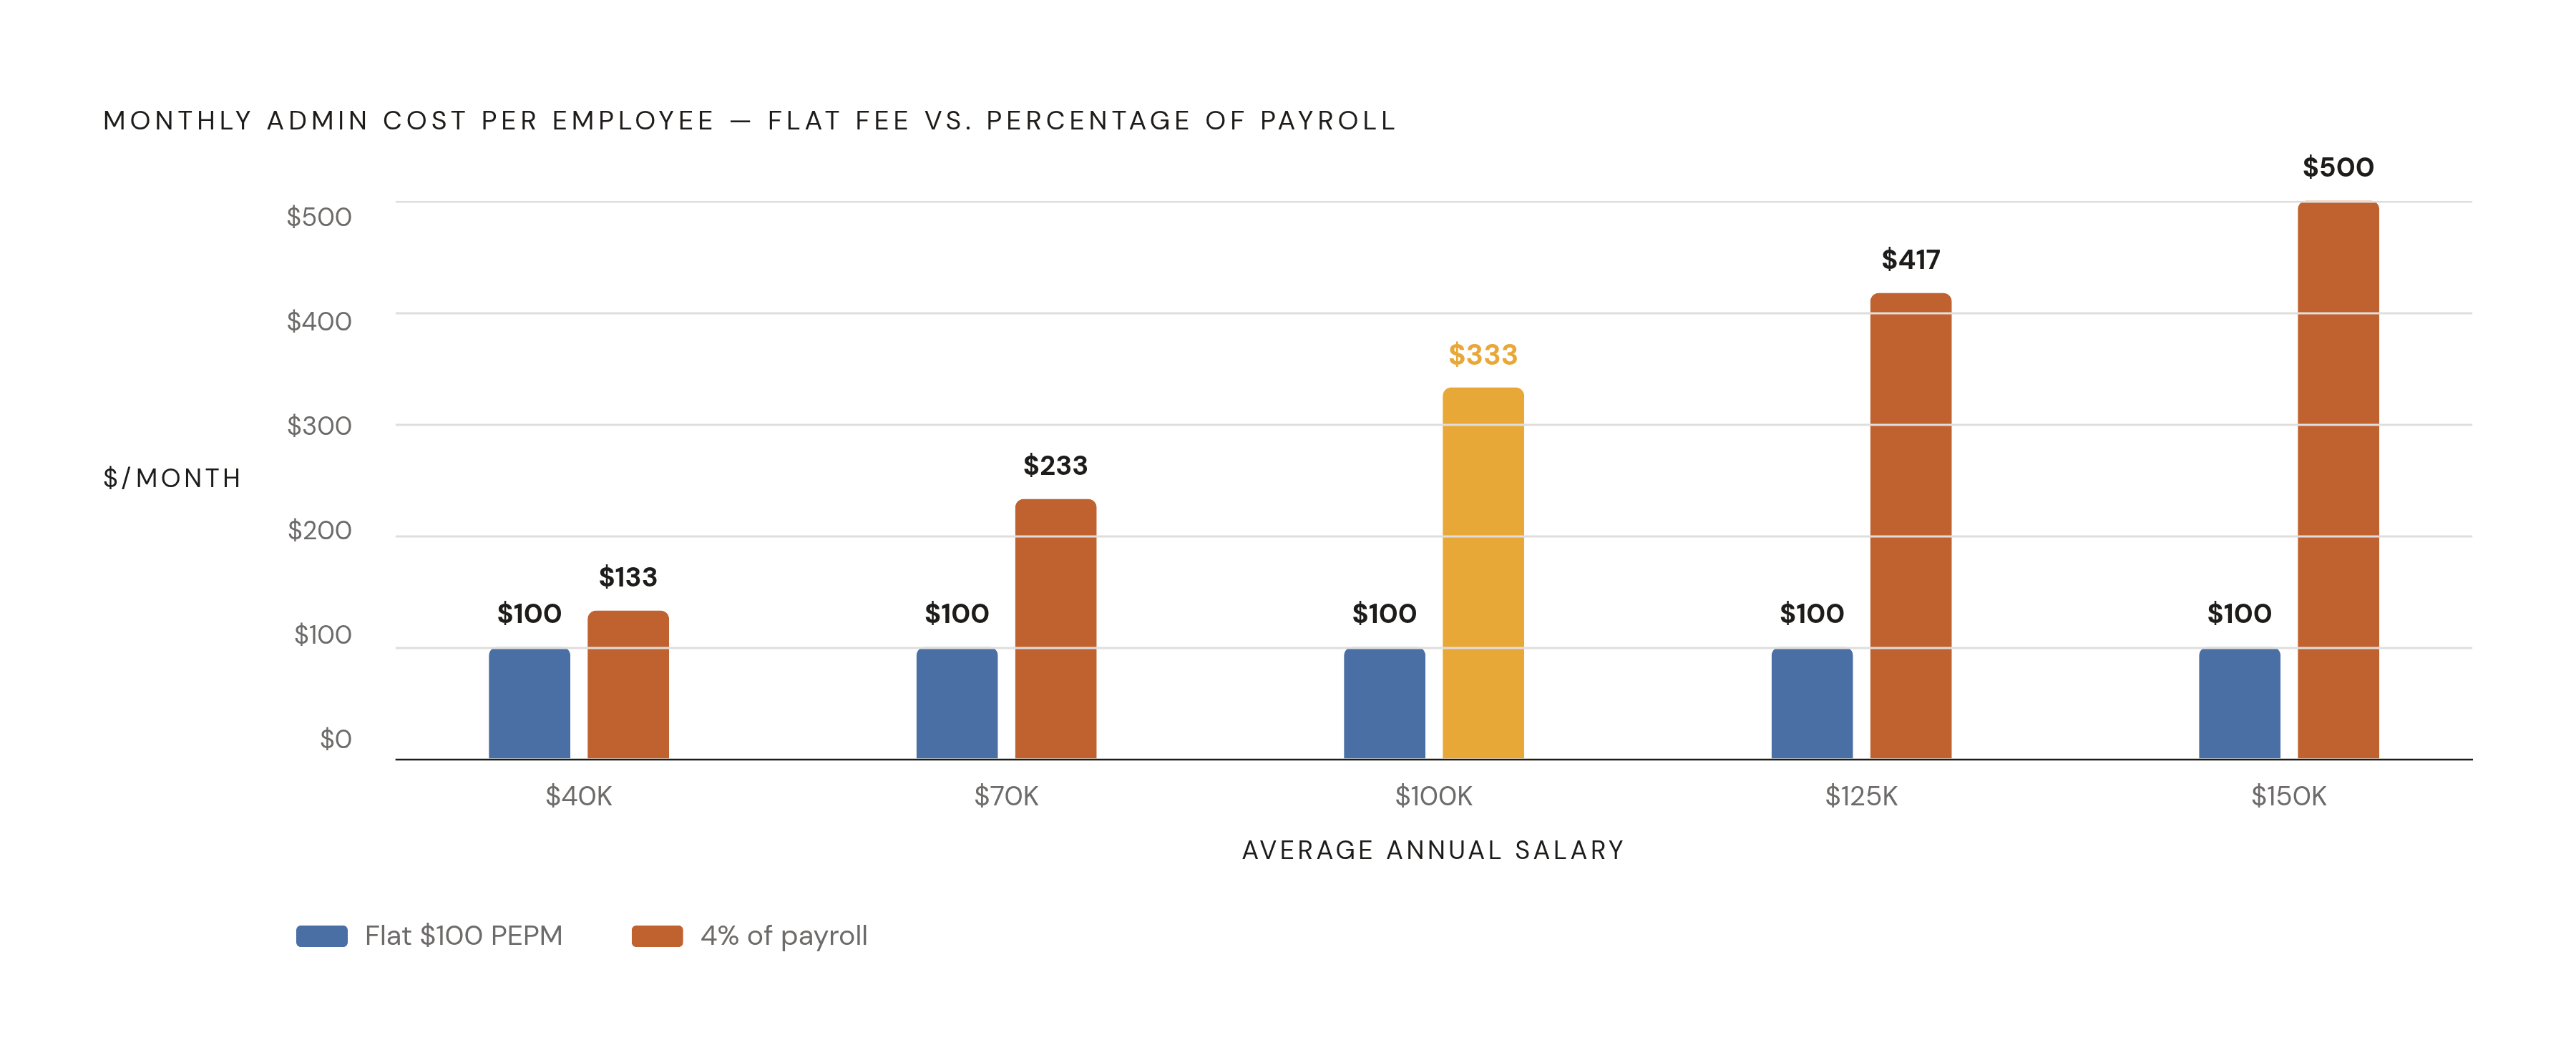
Choosing between the two comes down to salary level more than anything else. Flat fee wins at higher average compensation, and a comparison illustrating $100 a month against 4% of payroll shows flat pricing cheaper at every salary level from $40,000 to $150,000 PEO Cost Per Employee: A Practical Guide for 2026 PEO for Startups (2026) | eorHQ. Percentage models can still make sense where they bundle in deeper service, but for a Series B company with senior hires on the roster, the arithmetic tilts hard toward flat rate.
One more cost belongs in this section and rarely appears in the sales conversation: setup and onboarding fees, typically $200 to $500 per employee, which get left out of the headline quote often enough that they deserve a specific question at the negotiating table PEO Cost Per Employee (2026): PEPM vs Percentage. The typical range across the market is $40 to $160 per employee per month, per eorhq.com's guide. The most common range for full-service PEOs serving 25–200 employees is $80–$120 PEPM, per hotalinginsurance.com's PEO Cost: Pricing Models and Real Numbers PEO Cost 2026: Pricing Models and Real Numbers. For the 25–100 employee band specifically, the range is $50 to $130 per employee per month, per eorhq.com PEO Cost Per Employee (2026): PEPM vs Percentage PEO Cost 2026: Pricing Models and Real Numbers. The typical range is 2% to 12% of gross payroll at the broader market level, with eorhq.com's 2026 guide narrowing this to 2%–6% for most SMB engagements. Illustrative math from warp.co shows a 20-person startup at $100K average salaries paying $60K–$300K per year in PEO fees under a percentage model. This figure comes from eorHQ's pricing guide and PEO for Startups resource PEO for Startups (2026) | eorHQ.
The hidden cost layers that widen the all-in figure beyond the quoted rate
The administrative fee, that $40 to $160 PEPM figure, functions as the cover charge, not the total bill. Benefits costs and workers' comp pass-throughs sit on top of it, additive rather than included, and several of the biggest movers are genuinely unpredictable from one quarter to the next.
Three cost layers do most of the damage. Workers' comp true-ups arrive as a surprise invoice when actual payroll runs higher than what was projected at the start of the policy period; tech companies pay far less per $100 of payroll than higher-risk industries do, but a strong bonus quarter still triggers a true-up that nobody budgeted for PEO for Startups (2026) | eorHQ. Benefits renewal uplifts are the second layer, and they're getting sharper: health benefit cost per employee is expected to rise 6.5% in 2026, the steepest increase since 2010. PEO clients in pooled plans see that increase smoothed out somewhat compared to standalone small-group buyers, but the uplift still flows through to the bill.
A quieter mechanical issue also affects fees. Some PEOs calculate their fee against gross payroll rather than taxable wages PEO Cost 2026: Pricing Models and Real Numbers. Pre-tax deductions like health insurance premiums get folded into the base the percentage is applied to, inflating the fee beyond what a naive read of the contract would suggest.
Zooming out, the scale of what's being layered on top becomes clearer. Total employment cost runs 23% to 41% above base salary once every employer-side cost is counted, and benefits alone represent roughly 30% of total compensation in the U.S.. Finance teams should ask vendors for a total cost of ownership model rather than accepting the PEPM quote at face value, specifically pressing for the workers' comp rate, the benefits pass-through methodology, and the exit clause terms before anything gets signed. Early termination penalties run 25%–50% of remaining contract value where applicable, per eorhq.com, and annual contracts make this a material exit barrier at renewal time.
Benchmarks by headcount band: what a Series B company at 30, 75, and 150 employees pays
Series B companies often start the year lean enough that PEO group health purchasing power still provides material savings.
At this band, the company is approaching ALE (Applicable Large Employer) status under the ACA, and the PEO's compliance umbrella becomes both more valuable and more worth scrutinizing. The ACA affordability threshold itself is moving too, rising from 9.02% for 2025 plan years to 9.96% for plan years beginning in 2026, and companies nearing ALE status may need to adjust employee contribution levels in response.
This is the band where the ROI math starts to invert: the NAPEO-cited 27.2% annual cost savings ROI assumes the company is still capturing group purchasing benefits and HR cost avoidance that a 150-person company with a forming HR team can partially replicate independently. Health costs compound the tension: average employer health cost is projected to surpass $17,000 per employee in 2026, and at 150 heads that line item dominates the budget, even as the PEO's group purchasing edge, a 10% to 25% premium reduction typically reserved for sub-100-employee companies, starts eroding as the company's own group size grows large enough to negotiate on its own.
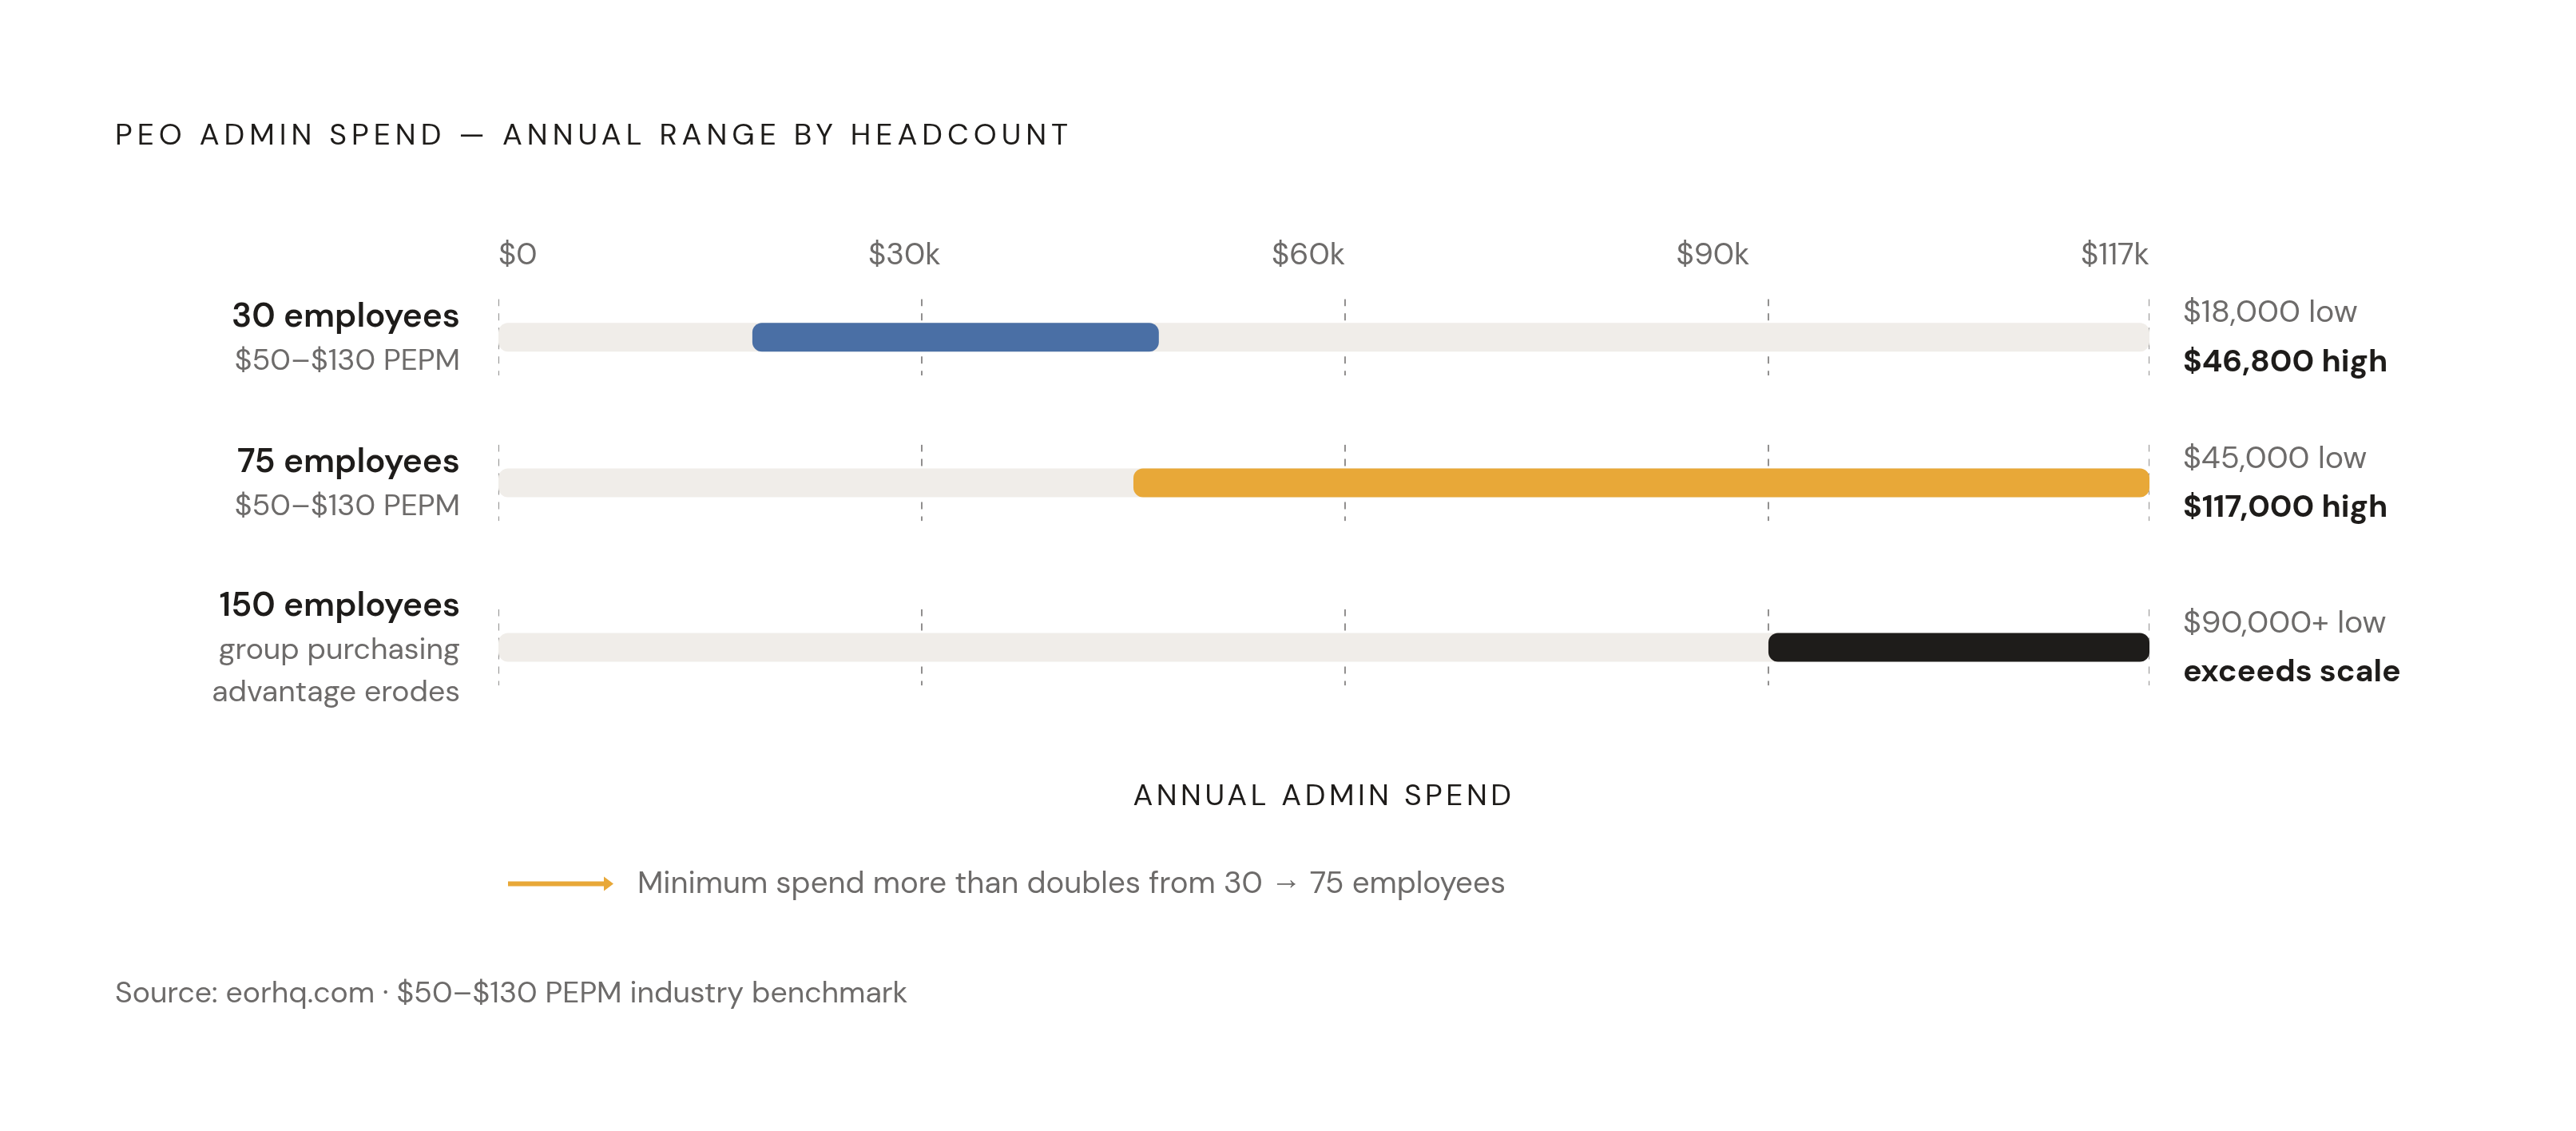
The PEPM rate compresses as headcount grows, but total annual admin spend scales up, and the value delivered per dollar paid by the PEO relative to alternatives narrows (the core tension a Series B CFO is pricing at renewal). That narrowing is the exact tension a Series B CFO is pricing, whether explicitly or not, at every renewal conversation. One benchmark band examined is the 30-employee band. Typical annual admin spend at this size is $18,000–$46,800 per year before benefits pass-throughs, workers' comp true-ups, and exit penalties, per eorhq.com's PEO Cost Per Employee guide PEO Cost Per Employee (2026): PEPM vs Percentage. The monthly range at this size is $50–$130 per employee per month, per eorhq.com. Another benchmark band examined is the 75-employee band. Per eorhq.com's size-tier table, the range is $50–$130 per employee per month, with a typical annual admin spend of $45,000–$117,000. A third benchmark band examined is the 150-employee band.
Real Value of PEOs for Series B Companies
Below roughly 100 employees, the health insurance pooling advantage is not theoretical. A 15-person company shopping standalone gets classified as small group, faces limited plan design options, and can see premiums spike 15% to 30% after a single bad claims year PEO Exit Strategy: A Step-by-Step Playbook for 2026 Stealth Agents. Routed through a PEO instead, that same company gets pooled into the PEO's large-group classification, and rate increases smooth out to roughly 5% to 8% annually versus 10% to 15% standalone PEO Exit Strategy: A Step-by-Step Playbook for 2026 Stealth Agents. For context, the average total single premium in 2025 ran around $777 a month, with the average employee contribution closer to $120, and the employer-side gap between small-group and large-group pricing produces the PEO's entire value proposition.
The bundling extends past health insurance. Workers' comp gets handled pay-as-you-go rather than requiring a large upfront deposit premium, which matters for a cash-flow-conscious Series B company still watching runway closely.
The HR overhead argument holds up under scrutiny too. NAPEO's oft-cited study found companies using PEOs achieved 27.2% annual cost savings ROI, or $272 saved per $1,000 spent, and a separate estimate puts average startup savings at $450 per employee annually in HR overhead once payroll, benefits admin, and compliance get outsourced. PEO clients also see 10% to 14% lower employee turnover and are 50% less likely to shut down altogether.
Where does the value actually stop earning its fee? There's also a recruiting stake that never appears on the PEPM invoice: if the benefits package is on the wrong side of market, candidates walk at the offer stage, and that's a real cost a well-run PEO relationship prevents even though it's invisible in the monthly bill. The savings quantum is $100–$200 per employee per month on medical alone, and for 15 employees that amounts to $18,000–$36,000 per year, which per eorhq.com may exceed the PEO's entire service fee. One area of value is 401(k) and ancillary benefits bundling. Standalone 401(k) plans cost $1,500–$5,000 to set up plus $2,000–$8,000 per year in admin fees, whereas through a PEO these costs are bundled, per eorhq.com's guide. The value erodes as headcount grows because the company's own group size starts to provide insurance leverage independently, internal HR capacity reduces the compliance and admin dependency, and the pooled benefits model limits plan customization that larger workforces increasingly need.
The inflection point: signals that a Series B startup has outgrown its PEO
The structural break point is fairly well defined. PEOs are strongest for companies under 50 employees that need HR infrastructure built fast, while brokers tend to become the stronger fit once a company has 10 or more employees and wants benefits priced around its own specific workforce rather than folded into someone else's shared pool.
A handful of operational signals tend to appear together when a company has crossed that line. Multi-state hiring has accelerated sharply across the market: 2026 alone brought 19 minimum wage increases, three new paid family and medical leave programs, eight state income tax cuts, and evolving pay transparency rules spanning 17 states plus D.C.. A PEO handles all of that, but at a certain size the company is effectively paying for compliance coverage it could source through a specialist at lower cost. Plan design flexibility is another marker: the pooled model curates a limited menu of options, and exiting opens up the full insurance market. Hidden fees are a third, with some PEOs becoming less transparent about pricing as the relationship deepens over time. Tax filings happen under the PEO's EIN, not the company's own, and this creates downstream friction at exit, including complications during lender and investor due diligence.
The NAPEO retention and ROI figures cited earlier come from averages across the full PEO client base, and a 100-person Series B company with an internal HR lead and payroll that keeps climbing is nowhere near the average PEO client. Most founders make the same negotiating error at the outset, avoiding any discussion of exit terms during the initial contract conversation. That's backwards, since founders who avoid discussing exit terms at the outset set themselves up for a worse negotiating position later. Startups that scale successfully almost always outgrow their first PEO, so exit terms deserve modeling from day one, not as an afterthought once the relationship has already turned uncomfortable.
The cost of a PEO exit and the risks of a poorly handled transition
The risks that don't show up in most exit decision models are the ones that hurt the most. One claim report found that 18% of mid-sized employers exiting a PEO faced temporary workers' comp coverage gaps, averaging $42,000 in uncovered liability per incident PEO Exit Strategy: A Step-by-Step Playbook for 2026. COBRA administration costs, meanwhile, spike 30% to 50% after exit because processing now has to happen manually PEO Exit Strategy: A Step-by-Step Playbook for 2026.
A clean exit depends on a short list of things going right simultaneously: payroll files have to move without corruption, benefits coverage can't lapse for even a single day, workers' comp has to stay continuous across the transition, and employee records need to transfer intact to whatever system replaces the PEO. Missing any one of those leaves the company dealing with angry employees, gaps in coverage, or both, at the exact moment it's trying to prove operational maturity to its own board.
EIN recapture deserves its own line item. Every tax filing during the PEO relationship happened under the PEO's own EIN, and recapturing the company's independent EIN history at exit requires direct coordination with the IRS, work that can affect loan applications, government contracting eligibility, and investor due diligence down the line. For any Series B company with a meaningful voluntary termination rate, that 30% to 50% COBRA cost spike isn't an abstract risk sitting in a footnote somewhere. For a Series B company with significant voluntary termination rates, a 30%–50% increase in COBRA admin costs is not abstract. Early termination exposure of 25%–50% of remaining contract value where applicable, per eorhq.com, represents a material cash event on a large-group contract that belongs in the exit model.
Sources
- Startup Hiring Cost 2026: $4K-$28K per Hire | Stealth Agents
- PEO Cost Per Employee (2026): PEPM vs Percentage
- PEO for Startups (2026) | eorHQ
- PEO Cost Per Employee: A Practical Guide for 2026
- How much does a PEO cost? 2026 pricing guide
- PEO Cost 2026: Pricing Models and Real Numbers
- PEO Exit Strategy: A Step-by-Step Playbook for 2026